Visualizing advance of perihelion of a test particle in Schwarzschild space-time
Importing the required modules
[1]:
import numpy as np
import astropy.units as u
from einsteinpy.plotting import ScatterGeodesicPlotter
Defining various parameters
Mass of the attractor(M)
Initial position and velocity vectors of test partcle
[2]:
M = 6e24 * u.kg
pos = [130*u.m, np.pi/2*u.rad, -np.pi/8*u.rad]
vel = [0*u.m/u.s, 0*u.rad/u.s, 1900*u.rad/u.s]
Plotting the trajectory
[3]:
%matplotlib inline
obj = ScatterGeodesicPlotter(M)
obj.plot(pos, vel, 0.002, 5e-8)
obj.show()
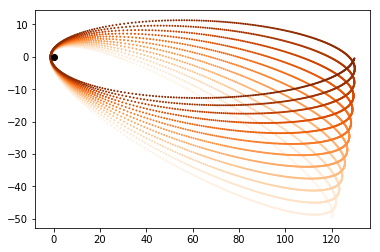
It can be seen that the orbit advances along the azimuth angle on each revolution of test partcle .